I have noticed this behaviour before but thought it was a one-off (or maybe something I had done).
If you stop and start MX and there is a change of month in the defined graph data series interval (mine is set to 72 hours) then the data from the last record before MX was stopped until the first record after the turn of the month (mine is set to 0900) does not get plotted. The data is present in the monthly data files, but is not present in the JSON responses supplied to the graph.
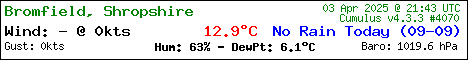
Attached are a screenshot and the temperature JSON file (saved with a .txt extension to get round upload permissions).
Note that this behaviour occurs in the interface as well. It looks as if it is a defect with the populating of the JSON files from archive data when the above conditions are met.
Welcome to the Cumulus Support forum.
Latest Cumulus MX V3 release 3.28.6 (build 3283) - 21 March 2024
Cumulus MX V4 beta test release 4.0.0 (build 4019) - 03 April 2024
Legacy Cumulus 1 release 1.9.4 (build 1099) - 28 November 2014
(a patch is available for 1.9.4 build 1099 that extends the date range of drop-down menus to 2030)
Download the Software (Cumulus MX / Cumulus 1 and other related items) from the Wiki
Graphs not drawing correctly after restart under certain circumstances
Moderator: mcrossley
-
freddie
- Posts: 2475
- Joined: Wed 08 Jun 2011 11:19 am
- Weather Station: Davis Vantage Pro 2 + Ecowitt
- Operating System: GNU/Linux Ubuntu 22.04 LXC
- Location: Alcaston, Shropshire, UK
- Contact:
Graphs not drawing correctly after restart under certain circumstances
You do not have the required permissions to view the files attached to this post.
Freddie
-
steve

- Cumulus Author
- Posts: 26701
- Joined: Mon 02 Jun 2008 6:49 pm
- Weather Station: None
- Operating System: None
- Location: Vienne, France
- Contact:
Re: Graphs not drawing correctly after restart under certain circumstances
Can you clarify - you stopped Cumulus on Saturday at about 1435, and restarted it today (or some time after the start of the month)? If you restart it now, does it correctly draw the graphs?
Could you also please zip up the MXdiags folder and attach it, together with your April log file.
Could you also please zip up the MXdiags folder and attach it, together with your April log file.
Steve
-
freddie
- Posts: 2475
- Joined: Wed 08 Jun 2011 11:19 am
- Weather Station: Davis Vantage Pro 2 + Ecowitt
- Operating System: GNU/Linux Ubuntu 22.04 LXC
- Location: Alcaston, Shropshire, UK
- Contact:
Re: Graphs not drawing correctly after restart under certain circumstances
Apologies - I have checked the diags files and there was an error message about a line in the April data file. I checked the data file, and there was a blank line in there. Removing the blank line has cleared the problem.
This must've been what happened the previous time too, so I apologise for jumping the gun and wasting your time - and will remember to check next time!
This must've been what happened the previous time too, so I apologise for jumping the gun and wasting your time - and will remember to check next time!
Freddie